


Send WordPress Activity Logs to Grafana Loki
Use Activity Log Pro Log Channels to stream WordPress activity logs to Grafana Loki in near real-time.
This works with both Grafana Cloud Loki and self-hosted Loki.
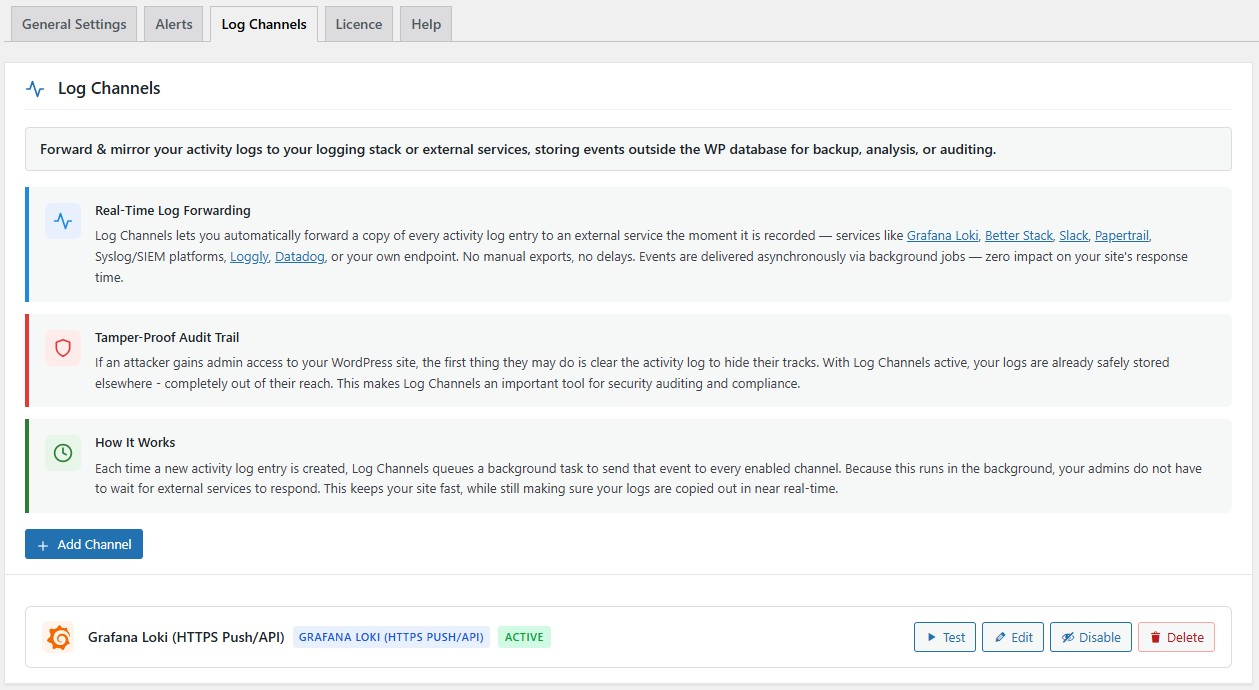
The Log Channels screen in Activity Log Pro shows a Grafana Loki integration configured and active, enabling real-time forwarding of WordPress activity logs via the Loki HTTPS Push API. It highlights asynchronous delivery, tamper-proof offsite storage, and seamless log ingestion into Grafana for monitoring and analysis.
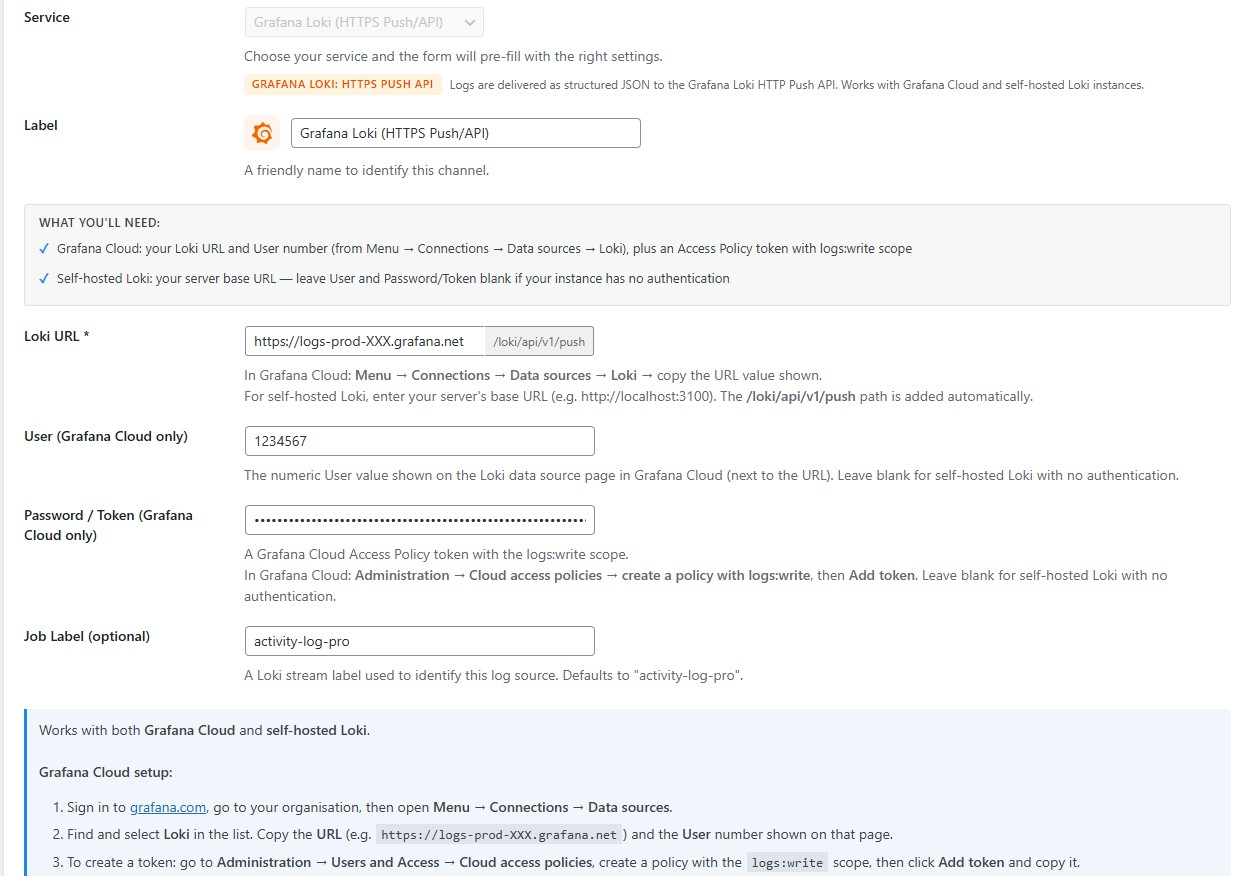
The Grafana Loki channel configuration screen in Activity Log Pro shows how to connect WordPress activity logs to Loki using the HTTPS Push API. It includes fields for the Loki URL, user ID, and access token, along with optional job labels, and provides setup guidance for both Grafana Cloud and self-hosted Loki instances.
What this integration does
When enabled, each new WordPress activity event is queued and sent to Loki using the Loki Push API.
You can centralise and query events like:
- User logins and failed logins
- Plugin/theme changes
- Content and settings updates
- User/account and role activity
Great for security monitoring, audit trails, and multi-site visibility in Grafana.
Requirements
Before setup, make sure you have:
- Activity Log Pro Premium installed and activated
- Access to your WordPress admin (administrator)
- A Loki destination, either:
- Grafana Cloud Loki (URL + User ID + token), or
- Self-hosted Loki (base URL, auth optional)
Setup (step-by-step)
- In WordPress admin, go to Activity Log Pro → Settings → Log Channels.
- Click Add Channel.
- Select Grafana Loki (HTTPS Push/API).
- Enter a label (example:
My Grafana Loki Instance). - Fill Loki URL (base URL only, no push path):
- Example:
https://logs-prod-XXX.grafana.net - Or self-hosted:
http://localhost:3100
- Example:
- If using Grafana Cloud, fill:
- User (Grafana Cloud only) (numeric user value)
- Password / Token (Grafana Cloud only) (token with
logs:writescope)
- (Optional) Set Job Label (default:
activity-log-pro). - Save the channel and ensure it is Enabled.
- Click Test on the channel row to send a test event.
Note: Activity Log Pro automatically appends
/loki/api/v1/pushto the base URL.
Verify logs in Grafana
Open Explore in Grafana and run:
{job="activity-log-pro"}You should see incoming log lines from WordPress.
Helpful follow-up queries:
{job="activity-log-pro", level="warn"}
{job="activity-log-pro", event_type="Login_failed"}
If you want to query JSON fields inside the log line:
{job="activity-log-pro"} | jsonThen filter on parsed fields (example):
{job="activity-log-pro"} | json | user_login="admin"How data is labelled in Loki
Each stream includes labels similar to:
job(defaultactivity-log-pro, configurable)site(host from your WordPress site URL)level(infoorwarn)event_type(from the activity event)
The full event payload is sent as JSON log content, so you can parse/query extra fields in Grafana.
Example payload (as stored in log line)
{
  "id": 12345,
  "timestamp": "2026-04-30 11:20:00",
  "event_type": "Login_failed",
  "object_type": "user",
  "user_login": "admin",
  "user_role": "administrator",
  "user_ip": "192.168.1.5",
  "description": "Failed login attempt for username: admin",
  "site_url": "https://example.com",
  "site_name": "Example Site",
  "message": "Failed login attempt for username: admin",
  "service": "activity-log-pro",
  "ddsource": "wordpress",
  "hostname": "example.com",
  "ddtags": "env:production,team:security"
}
Recommended Grafana/Loki queries
- All WordPress activity logs
{job="activity-log-pro"} - Warning-level security-relevant events
{job="activity-log-pro", level="warn"} - Failed login events
{job="activity-log-pro", event_type="Login_failed"} - One specific site (multi-site/multi-client scenario)
{job="activity-log-pro", site="example.com"} - Parse full JSON and inspect by user
{job="activity-log-pro"} | json | user_login="admin"
Performance and delivery behavior
- Delivery is asynchronous (queued), so admin actions are not blocked by external log delivery.
- Use the built-in Test button for quick validation.
- Channel errors are shown in Log Channels if delivery fails.
Troubleshooting
No logs in Grafana
- Confirm channel is enabled.
- Re-check Loki base URL.
- For Grafana Cloud, verify User + Token are correct.
- Ensure token has
logs:writescope. - Run channel Test and check status/error.
Authentication errors
- Grafana Cloud requires HTTP Basic Auth with:
- username = User ID
- password = token
- Recreate token if needed and update channel settings.
Wrong endpoint/path issues
- Enter base URL only in plugin settings.
- Do not manually add
/loki/api/v1/push(plugin adds this automatically).
Query returns empty
- Start with
{job="activity-log-pro"}first. - Remove extra filters.
- Confirm your custom Job Label if you changed it.
FAQ
Does this support self-hosted Loki?
Yes. Self-hosted Loki is supported, including setups without authentication.
Can I send logs to Loki and other channels at the same time?
Yes. Multiple channels can be active together.
Will this slow my site down?
No. Events are sent via background queue for minimal impact.
What success response does Loki return?
Loki commonly returns 204 No Content on successful push.
Need help?
If setup fails, share with support:
- Selected channel type and config (redact secrets)
- Loki URL used
- Grafana Cloud vs self-hosted
- Test result/error message
- Example query used in Grafana Explore
Back to Log Channels.